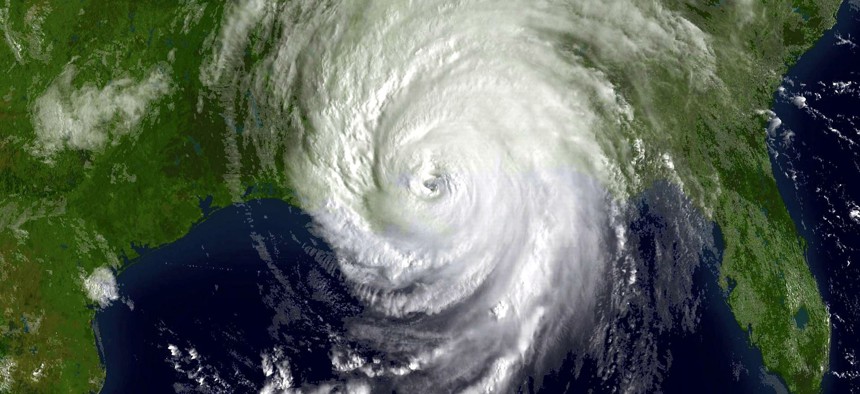
A GOES-12 visible image of Hurricane Katrina shortly after landfall on August 29, 2005 at 1415z. NOAA/NASA GOES Project
How NGA Is Turning Disaster-Relief Mapping Into a Game
A Q&A about GeoQ, the open-source disaster mapping system from the National Geospatial-Intelligence Agency.
For more than a year, the National Geospatial-Intelligence Agency has been refining its open-source disaster mapping system, GeoQ . The system lets first responders document damage — tornado wreckage, for instance — and upload geo-tagged images to an open, crowdsourced, searchable map, helping to ensure responders aren't duplicating their clean-up and rescue efforts.
The spy agency is continually updating GeoQ — adding new features such as color-tagging workflow — and NGA is still figuring out how to measure whether it's worth the time and financial investment. NGA tech lead Ray Bauer chatted with Nextgov about the agency's efforts to trim inefficiency by giving first responders a clearer picture of disaster scenes.
This conversation has been edited for length and clarity.
NG: What are NGA's future plans for GeoQ? How is it evolving?
RB: [NGA Director Robert] Cardillo really wants us to push forward with the "democratization of GEOINT [geospatial intelligence]" -- his words. How we to pull in a lot of this data that's out there and make sense of the noise?
In talking with [GeoQ's Huntsville, Alabama, team], they noted that during emergency response in triage centers, first responders were actually writing on their arms the number of critically injured to to less-severely injured to keep track of those numbers at a location. So we added the ability to triage, and a way for them to add information to an online version of a triage list that, in real time, hospitals could watch as those numbers would increase or decrease.
NG: How do you measure success of open source projects like GeoQ?
RB: Since it’s new for us, trying to collect the appropriate business analytics is kind of an emerging science for us. One of the ways I've been measuring the success of GeoQ is the number of stars that it’s gotten on GitHub. Stars are the equivalent of "likes." GeoQ has received over 237 as of this morning. Somebody out on GitHub made a heatmap that shows you all over the globe people that have starred your repository. We’re not trending in Kazakhstan yet, but we are in some areas of Asia and Europe.
NG: How do you market this project to first-response teams?
RB: We’re kind of new to this, especially with Github, even though we've been out there for over a year.
We have created these projects for anyone to participate with us in developing, or even for companies to take the code and make it better, and possibly resell it. There's no restriction on the licensing for this.
Another person [on the GeoQ team] has been contacted by an insurance company who sees using GeoQ as a really great way to do an after-damage [report] to show where insurance agents have done adjustments.
NG: Tell us how you're gamifying disaster response on GeoQ.
RB: We set up the gamification server almost a year ago. It gives you badges and it gives you points, following a lot of those other apps like Waze and others. We kind of looked at them and tried to mimic some of the best features.
Right now, they are getting points for "Feature Creation." For each damaged house, they would get a point. You can see how this kind of wouldn't be fair if someone got an area that didn't have damage.
We want to use badges help develop our tradecraft. For example, if we have a group of people who do disaster response, we want to make sure everyone gets a "Tornado Badge," everyone gets a "Hurricane Badge," everyone gets an "Earthquake Badge." And then, we we can also measure their level of proficiency within that.
In a perfect world, we would want everyone who does disaster response to have all the badges and the maximum amount of points. That's one of our main goals.
We actually tested gamification during a tornado outbreak in Oklahoma a year and a half ago and we witnessed what was I thought pretty awesome. We didn't even tell the folks what the points were for, and people started to compete in a friendly way. They were actually coming to look for more work, because the analyst next to them had completed their work and had 10 points and they completed theirs, and only had eight.
We actually found one gentleman who was helping us test this system -- he was gaming the system. He was creating lots of little damage points, instead of drawing one damage polygon. What he taught us is we have a lot more to learn.
NG: What's GeoQ's ultimate goal?
RB: I'm trying to change the geospatial-intelligence collaboration [process] through GeoQ. All disasters are local, so when a tornado hits a small town in Alabama, local has to contact the state, which has to contact federal. That time takes away from disaster response. Instead of having the federal agencies be in the lead for some of these tools and doing damage assessment, I'm trying to flip that collaboration model on its head.
We’re also seeing that we can overcome certain legal and policy issues if we do change the collaboration model in putting the locals and states in the lead, [including laws about] domestic imagery. . . We as part of the intelligence community are not permitted to spy on U.S. persons, so in order to get imagery and collect it, we must go through the appropriate PUM, or Proper Use Memorandum, and through our lawyers, which takes time to do correctly.
However, the locals and these states don't have that hindrance. So they can start the process . . sometimes quicker than we can.