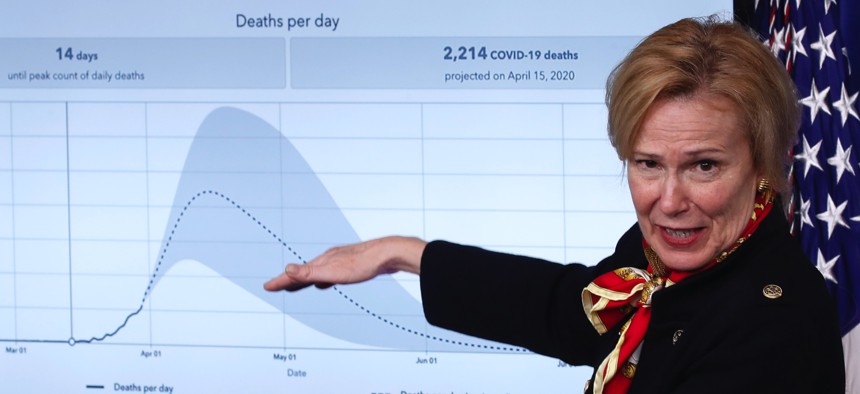
Dr. Deborah Birx, White House coronavirus response coordinator, speaks about the coronavirus in the James Brady Press Briefing Room of the White House, Tuesday, March 31, 2020, in Washington. AP / Alex Brandon
The COVID-19 Models Probably Don't Say What You Think They Say
If they accurately predict the future, we've done something wrong.
The Trump administration has just released the model for the trajectory of the COVID-19 pandemic in America. We can expect a lot of back-and-forth about whether its mortality estimates are too high or low. And its wide range of possible outcomes is certainly confusing: What’s the right number? The answer is both difficult and simple. Here’s the difficult part: There is no right answer. But here’s the simple part: Right answers are not what epidemiological models are for.
Epidemiologists routinely turn to models to predict the progression of an infectious disease. Fighting public suspicion of these models is as old as modern epidemiology, which traces its origins back to John Snow’s famous cholera maps in 1854. Those maps proved, for the first time, that London’s terrible affliction was spreading through crystal-clear fresh water that came out of pumps, not the city’s foul-smelling air. Many people didn’t believe Snow, because they lived in a world without a clear understanding of germ theory and only the most rudimentary microscopes.
In our time, however, the problem is sometimes that people believe epidemiologists, and then get mad when their models aren’t crystal balls. Take the United Kingdom’s drastic COVID-19 policy U-turn. A few weeks ago, the U.K. had almost no social-isolation measures in place, and according to some reports, the government planned to let the virus run its course through the population, with the exception of the elderly, who were to be kept indoors. The idea was to let enough people get sick and recover from the mild version of the disease, to create “herd immunity.”
Things changed swiftly after an epidemiological model from Imperial College London projected that without drastic interventions, more than half a million Britons would die from COVID-19. The report also projected more than 2 million deaths in the United States, again barring interventions. The stark numbers prompted British Prime Minister Boris Johnson, who himself has tested positive for COVID-19, to change course, shutting down public life and ordering the population to stay at home.
Related: US Sailors Pour Off Aircraft Carrier and Into Coronavirus Isolation on Guam
Related: Coronavirus Is Rising Around US Military, Defense Infrastructure, Analysis Shows
Related: The Prognosis: Latest News on Coronavirus & National Security
Here’s the tricky part: When an epidemiological model is believed and acted on, it can look like it was false. These models are not snapshots of the future. They always describe a range of possibilities—and those possibilities are highly sensitive to our actions. A few days after the U.K. changed its policies, Neil Ferguson, the scientist who led the Imperial College team, testified before Parliament that he expected deaths in the U.K. to top out at about 20,000. The drastically lower number caused shock waves: One former New York Timesreporter described it as a “a remarkable turn,” and the British tabloid the Daily Mail ran a story about how the scientist had a “patchy” record in modeling. The conservative site The Federalist even declared, “The Scientist Whose Doomsday Pandemic Model Predicted Armageddon Just Walked Back the Apocalyptic Predictions.”
But there was no turn, no walking back, not even a revision in the model. If you read the original paper, the model lays out a range of predictions—from tens of thousands to 500,000 dead—which all depend on how people react. That variety of potential outcomes coming from a single epidemiological model may seem extreme and even counterintuitive. But that’s an intrinsic part of how they operate, because epidemics are especially sensitive to initial inputs and timing, and because epidemics grow exponentially.
Modeling an exponential process necessarily produces a wide range of outcomes. In the case of COVID-19, that’s because the spread of the disease depends on exactly when you stop cases from doubling. Even a few days can make an enormous difference. In Italy, two similar regions, Lombardy and Veneto, took different approaches to the community spread of the epidemic. Both mandated social distancing, but only Veneto undertook massive contact tracing and testing early on. Despite starting from very similar points, Lombardy is now tragically overrun with the disease, having experienced roughly 7,000 deaths and counting, while Veneto has managed to mostly contain the epidemic to a few hundred fatalities. Similarly, South Korea and the United States had their first case diagnosed on the same day, but South Korea undertook massive tracing and testing, and the United States did not. Now South Korea has only 162 deaths, and an outbreak that seems to have leveled off, while the U.S. is approaching 4,000 deaths as the virus’s spread accelerates.
Exponential growth isn’t the only tricky part of epidemiological models. These models also need to use parameters to plug into the variables in the equations. But where should those parameters come from? Model-makers have to work with the data they have, yet a novel virus, such as the one that causes COVID-19, has a lot of unknowns.
For example, the Imperial College model uses numbers from Wuhan, China, along with some early data from Italy. This is a reasonable choice, as those are the pandemic’s largest epicenters. But many of these data are not yet settled, and many questions remain. What’s the attack rate—the number of people who get infected within an exposed group, like a household? Do people who recover have immunity? How widespread are asymptomatic cases, and how infectious are they? Are there super-spreaders—people who seemingly infect everyone they breathe near—as there were with SARS, and how prevalent are they? What are the false positive and false negative rates of our tests? And so on, and on and on.
To make models work, epidemiologists also have to estimate the impact of interventions like social isolation. But here, too, the limited data we have are imperfect, perhaps censored, perhaps inapplicable. For example, China underwent a period in which the government yanked infected patients and even their healthy close contacts from their homes, and sent them into special quarantine wards. That seems to have dramatically cut down infections within a household and within the city. Relatively few infected people in the United States or the United Kingdom have been similarly quarantined. In general, the lockdown in China was much more severe. Planes are still taking off from New York, New Jersey, and everywhere else, even as we speak of “social isolation.” And more complications remain. We aren’t even sure we can trust China’s numbers. Italy’s health statistics are likely more trustworthy, but its culture of furbizia—or flouting the rules, part of the country’s charm as well as its dysfunction—increases the difficulty of knowing how applicable its outcomes are to our projections.
A model’s robustness depends on how often it gets tried out and tweaked based on data and its performance. For example, many models predicting presidential elections are based on data from presidential elections since 1972. That’s all the elections we have polling data for, but it’s only 12 elections, and prior to 2016, only two happened in the era of Facebook. So when Donald Trump, the candidate that was projected to be less likely to win the presidency in 2016, won anyway, did that mean that our models with TV-era parameters don’t work anymore? Or is it merely that a less likely but possible outcome happened? (If you’re flipping a coin, you’ll get four heads in a row about one every 16 tries, meaning that you can’t know if the coin is loaded just because something seemingly unusual happens). With this novel coronavirus, there are a lot of things we don’t know because we’ve never tested our models, and we have no way to do so.
So if epidemiological models don’t give us certainty—and asking them to do so would be a big mistake—what good are they? Epidemiology gives us something more important: agency to identify and calibrate our actions with the goal of shaping our future. We can do this by pruning catastrophic branches of a tree of possibilities that lies before us.
Epidemiological models have “tails”—the extreme ends of the probability spectrum. They’re called tails because, visually, they are the parts of the graph that taper into the distance. Think of those tails as branches in a decision tree. In most scenarios, we end up somewhere in the middle of the tree—the big bulge of highly probable outcomes—but there are a few branches on the far right and the far left that represent fairly optimistic and fairly pessimistic, but less likely, outcomes. An optimistic tail projection for the COVID-19 pandemic is that a lot of people might have already been infected and recovered, and are now immune, meaning we are putting ourselves through a too-intense quarantine. Some people have floated that as a likely scenario, and they are not crazy: This is indeed a possibility, especially given that our testing isn’t widespread enough to know. The other tail includes the catastrophic possibilities, like tens of millions of people dying, as in the 1918 flu or HIV/AIDS pandemic.
The most important function of epidemiological models is as a simulation, a way to see our potential futures ahead of time, and how that interacts with the choices we make today. With COVID-19 models, we have one simple, urgent goal: to ignore all the optimistic branches and that thick trunk in the middle representing the most likely outcomes. Instead, we need to focus on the branches representing the worst outcomes, and prune them with all our might. Social isolation reduces transmission, and slows the spread of the disease. In doing so, it chops off branches that represent some of the worst futures. Contact tracing catches people before they infect others, pruning more branches that represent unchecked catastrophes.
At the beginning of a pandemic, we have the disadvantage of higher uncertainty, but the advantage of being early: The costs of our actions are lower because the disease is less widespread. As we prune the tree of the terrible, unthinkable branches, we are not just choosing a path; we are shaping the underlying parameters themselves, because the parameters themselves are not fixed. If our hospitals are not overrun, we will have fewer deaths and thus a lower fatality rate. That’s why we shouldn’t get bogged down in litigating a model’s numbers. Instead we should focus on the parameters we can change, and change them.
Every time the White House releases a COVID-19 model, we will be tempted to drown ourselves in endless discussions about the error bars, the clarity around the parameters, the wide range of outcomes, and the applicability of the underlying data. And the media might be tempted to cover those discussions, as this fits their horse-race, he-said-she-said scripts. Let’s not. We should instead look at the calamitous branches of our decision tree and chop them all off, and then chop them off again.
Sometimes, when we succeed in chopping off the end of the pessimistic tail, it looks like we overreacted. A near miss can make a model look false. But that’s not always what happened. It just means we won. And that’s why we model.